Canvas
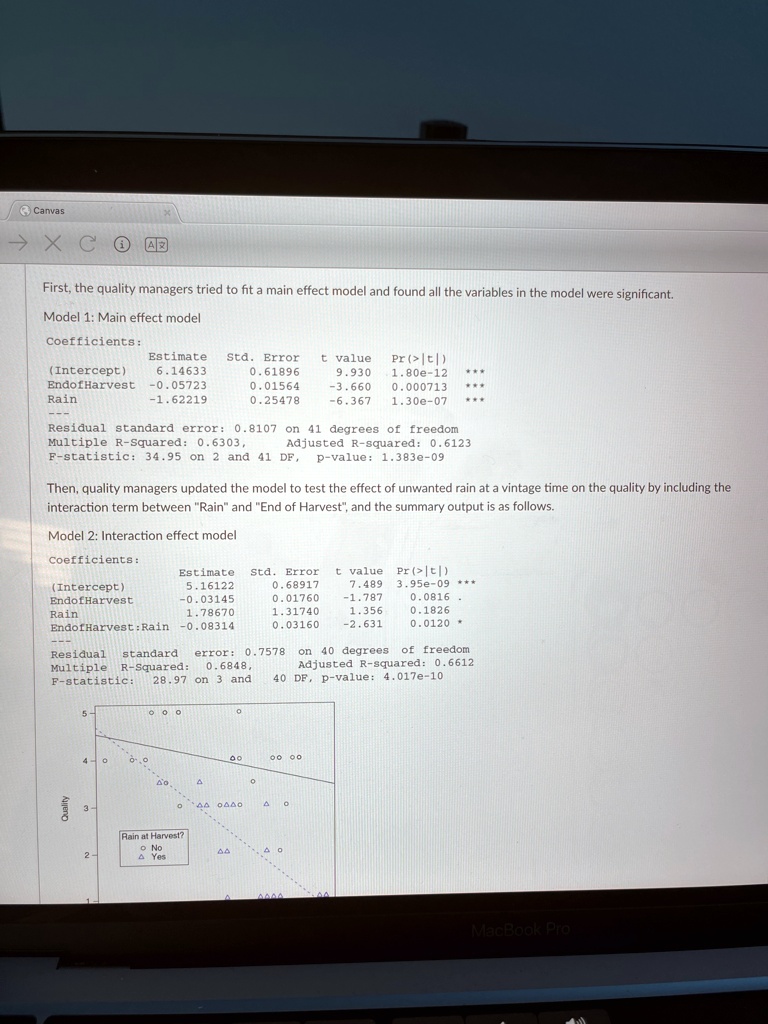
First, the quality managers tried to fit a main effect model and found all the variables in the model were significant.
Model 1: Main effect model
Coefficients:
able[[,Estimate,Std. Error,t value,Pr()>(|t|),],[(Intercept),6.14633,0.61896,9.930,1.80e-12,***],[EndofHarvest,-0.05723,0.01564,-3.660,0.000713,********]]
Canvas
First, the quality managers tried to fit a main effect model and found all the variables in the model were significant. Model 1: Main effect model Coefficients: Estimate std. Error t value Pr>|t| (Intercept) 6.14633 0.61896 9.930 1.80e-12 EndofHarvest -0.05723 0.01564 -3.660 0.000713 Rain -1.62219 0.25478 -6.367 1.30e-07 Residual standard error: 0.8107 on 41 degrees of freedom Multiple R-Squared: 0.6303, Adjusted R-squared: 0.6123 F-statistic 34.95 on 2 and 41 DF, p-value: 1.383e-09
Then, quality managers updated the model to test the effect of unwanted rain at a vintage time on the quality by including the interaction term between "Rain" and End of Harvest, and the summary output is as follows.
Model 2: Interaction effect model
Coefficients:
Estimate std. Error t value Pr>|t| Intercept) 5.16122 0.68917 7.489 3.95e-09** EndofHarvest -0.03145 0.01760 -1.787 0.0816 1.78670 1.31740 1.356 0.1826 Rain EndofHarvest:Rain -0.08314 0.03160 -2.631 0.0120*
Residual standard error: 0.7578 on 40 degrees of freedom Multiple R-Squared: 0.6848 Adjusted R-squared: 0.6612 F-statistic: 28.97 on 3 and 40 DF, p-value: 4.017e-10
Rain at Harvest? o No Yes
MacBook Pro