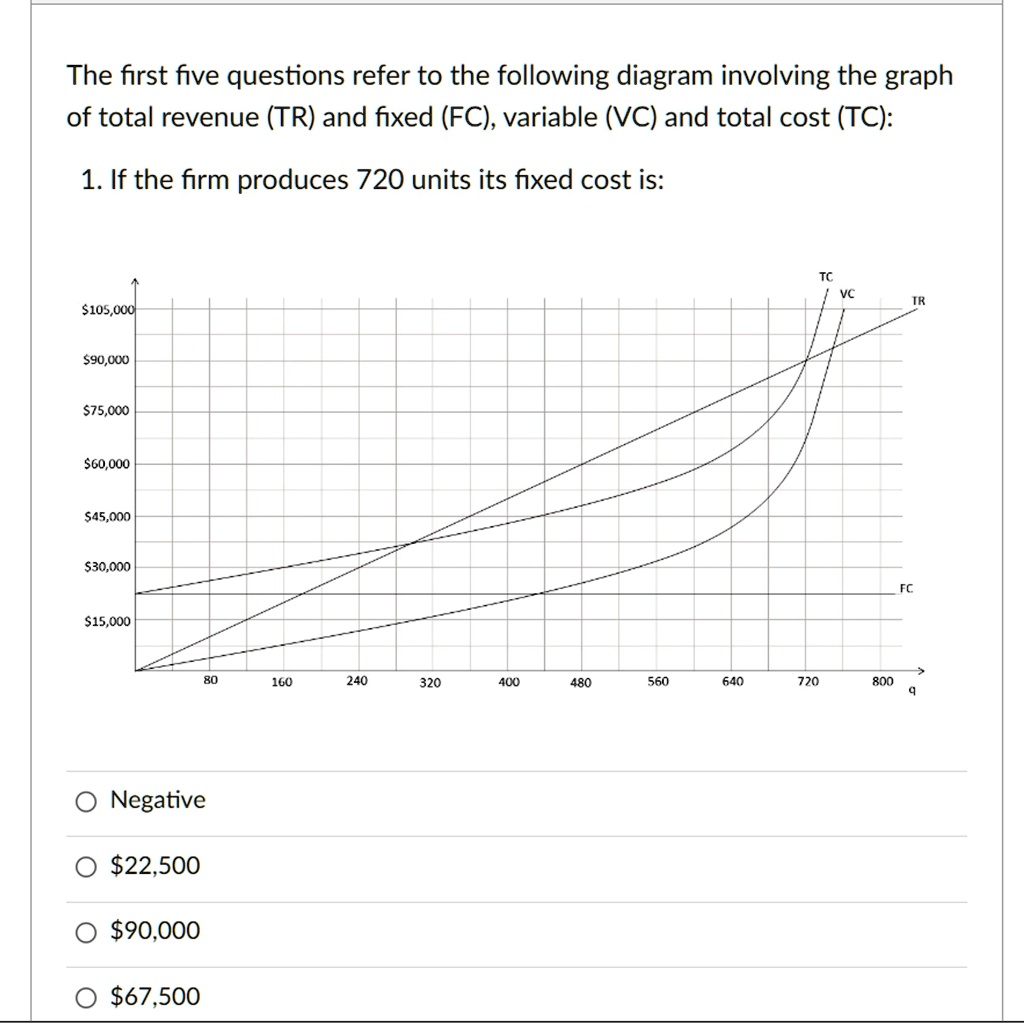
The first five questions refer to the following diagram involving the graph
of total revenue (TR) and fixed (FC), variable (VC) and total cost (TC):
1. If the firm produces 720 units its fixed cost is:
$105,000
$90,000
$75,000
$60,000
$45,000
$30,000
$15,000
TC
VC
TR
FC
80
160
240
320
400
480
560
640
720
800
?
q
O Negative
? $22,500
? $90,000
? $67,500