Ace - AI Tutor
Ask Our Educators
Textbooks
My Library
Flashcards
Scribe - AI Notes
Notes & Exams
Download App
sarah bryant

sarah b.

Divider

Questions asked

BEST MATCH

Compare liquids with solids in relation to Forces between particles, Arrangement of particles, Kinetic energy of particles & Movement of particles.

View Answer
divider
BEST MATCH

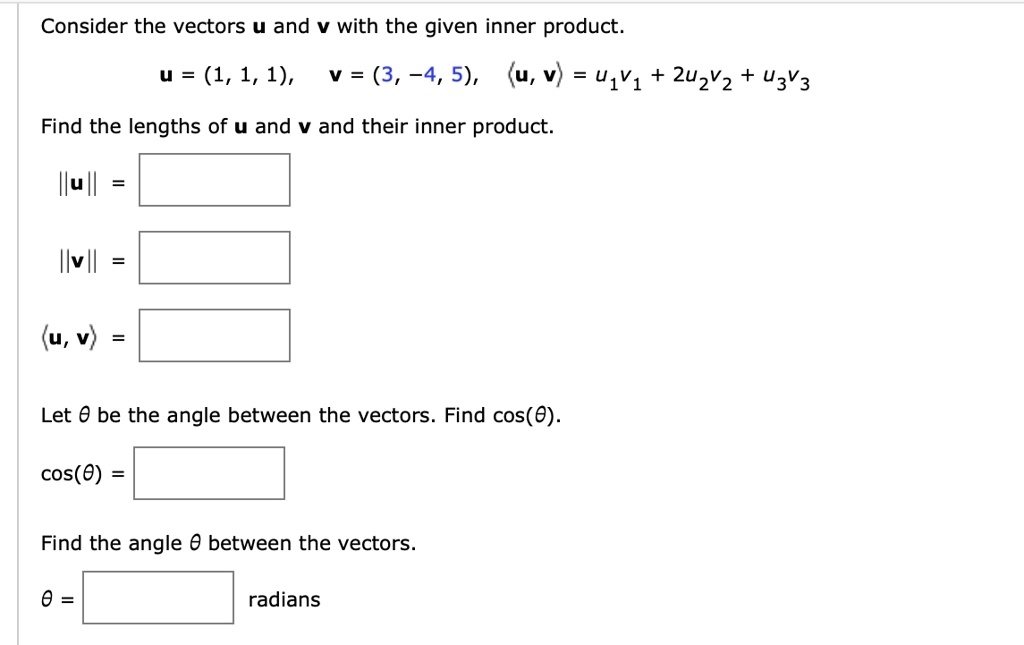
Consider the vectors \(\mathbf{u}\) and \(\mathbf{v}\) with the given inner product. \(\mathbf{u} = (1, 1, 1)\), \(\mathbf{v} = (3, -4, 5)\), \((\mathbf{u}, \mathbf{v}) = u_1v_1 + 2u_2v_2 + u_3v_3\ Find the lengths of \(\mathbf{u}\) and \(\mathbf{v}\) and their inner product. \(\|\mathbf{u}\|\) = \(\|\mathbf{v}\|\) = \((\mathbf{u}, \mathbf{v})\) = Let \(\theta\) be the angle between the vectors. Find \(\cos(\theta)\). \(\cos(\theta)\) = Find the angle \(\theta\) between the vectors. \(\theta =\) radians
View Answer
divider
BEST MATCH

If for a particular market a drop in price from $100 to $50 causes quantity supplied to decrease from million to 2 million units we can say that supply: is elastic is inelastic is perfectly inelastic is perfectly elastic has a price elasticity whose numerical value is exactly equal to one

View Answer
divider
BEST MATCH

b. Is it possible that the supply curve for oil also shifted? Suppose you were told that managers at oil firms were convinced that oil prices in the future were going to be significan are today. Would this fact help you answer the question? Given that managers at oil firms were convinced that oil prices in the future were going to be significantly lower than they are today, OA. it is likely that the supply curve for oil shifted to the left because firms will be more likely to decrease the supply of oil today and wait for higher prices later. B. it is likely that the supply curve for oil shifted to the right because firms will be more likely to increase the supply of oil today when prices are higher. C. it is likely that the supply curve for oil shifted to the right because firms will be more likely to decrease the supply of oil today and wait for higher prices later. D. it is likely that the supply curve for oil shifted to the left because firms will be more likely to increase the supply of oil today when pri

View Answer
divider
BEST MATCH

Score on last attempt: 1.7 out of 3 Score in gradebook: 1.7 out of 3 In the following questions, determine the behavior of $h(x) = \frac{4x^3 + 7x}{-x^3 + 7x}$. If a limit does not exist or the function is undefined, write DNE. a. For what value(s) of $x$ is $h(x)$ undefined? x = Preview b. For what value(s) of $x$ does $h(x)$ have a vertical asymptote? x = -\sqrt{7}, \sqrt{7} Preview c. For what value(s) of $x$ does $h(x)$ have a hole? x = Preview d. $\lim_{x \to 0} h(x) = 1$ Preview e. $\lim_{x \to \infty} h(x) = -4$ Preview f. $\lim_{x \to -\infty} h(x) = -4$ Preview g. $h(0) = \text{DNE}$ Preview h. Based on your work above, on what interval(s) is $h(x)$ continuous? $(-\infty, \infty)$ Preview $(-\infty, \infty) = (-\infty, \infty)$. Write your answer in interval notation. If you include multiple intervals, use u to denote union.

View Answer
divider
BEST MATCH

Table 4-16 The following table shows the supply and demand schedules in a market. Quantity Demanded Quantity Supplied Price ($) (units) (units) 0 50 0 2 40 15 4 30 30 6 20 45 8 10 60 10 0 75 1. Refer to Table 4-16. Draw the supply & demand curves. 2. Refer to Table 4-16. What is the equilibrium price in this market? 3. Refer to Table 4-16. What is the equilibrium quantity in this market? 4. Refer to Table 4-16. At a price of $2, will there be a surplus or shortage of units in this market? 5. Refer to Table 4-16. At a price of $8, how large of a surplus will there be in this market? 6. Refer to Table 4-16. If the supply curve shifts to the right, will the price in this market rise or fall?

View Answer
divider
BEST MATCH

55. [-/2 Points] DETAILS LARCALC11 5.R.097. MY NOTES ASK YOUR TEACHER Evaluate each expression without using a calculator. (Hint: Make a sketch of a right triangle.) (a) \sin(\arcsin(\frac{1}{2})) (b) \cos(\arcsin(\frac{1}{2})) Need Help? Read It

View Answer
divider
BEST MATCH

(1 point) Suppose the region on the left in the figure (with blue shading) has area is 21, and the region on the right (with green shading) has area 7. Using the graph of $f(x)$ in the figure, find the following integrals. $\int_a^b f(x) dx =$ $\int_b^c f(x) dx =$ $\int_a^c f(x) dx =$ $\int_a^c |f(x)| dx =$ Graph of $y = f(x)$

View Answer
divider
BEST MATCH

2. The three loads in circuit can be describe as follows: Load 1 is absorbing an average power of 7.5KW and 9KVAR (inductive), Load 2 is absorbing an average power of 2.1 kW and 1.8 KVAR (Capacitive), Load 3 consists of a 48 ohms resistor connected in series of reactance of 18.2 ohms. Assume that the voltage of $V_L = 480 \angle 0 V_{rms}$, 60Hz. Find: a. The value of $V_g$ b. The total complex power supplied by the source c. The value of capacitor that needs to be connected in parallel after the $V_g$. to raise the pf to unity.

View Answer
divider
BEST MATCH

4.3 Erbium doped fiber amplifier A glass fiber has been doped with Er$^{3+}$ ions with doping concentration 8 × 10$^{18}$ Er$^{3+}$ ions cm$^{-3}$. Emission and absorption cross-sections of this EDFA at a wavelength of 1550 nm are found to be 3 × 10$^{-21}$ cm$^2$ and 2 × 10$^{-21}$ cm$^2$, respectively. The Er$^{3+}$ doped fiber is pumped from a 1480 nm laser diode. Obtain the maximum gain coefficient in terms of dB m$^{-1}$ of this medium at 1550 nm. You may assume that the maximum gain coefficient is obtained when there is full population inversion ($N_1$ = 0).

View Answer
divider