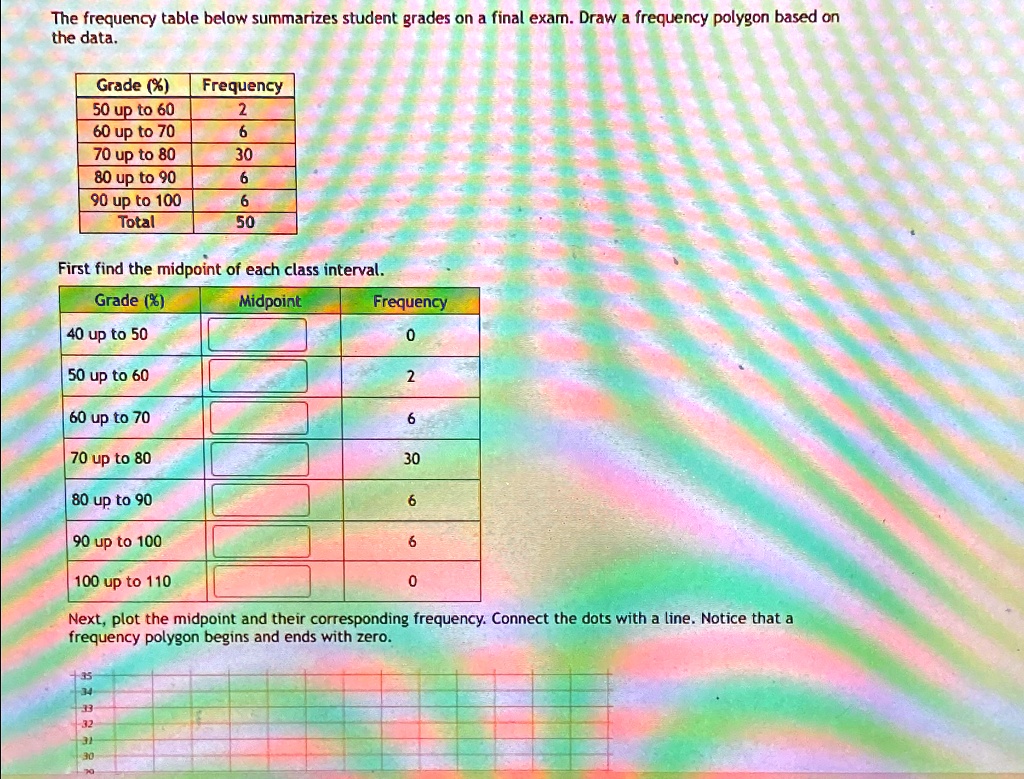
The frequency table below summarizes student grades on a final exam. Draw a frequency polygon based on the data.
able[[Grade (%),Frequency],[50 up to 60,2],[60 up to 70,6],[70 up to 80,30],[80 up to 90,6],[90 up to 100,6],[Total,50]]
First find the midpoint of each class interval.
able[[Grade (%),Midpoint,Frequency],[40 up to 50,,0],[50 up to 60,,2],[60 up to 70,,6],[70 up to 80,,30],[80 up to 90,,6],[90 up to 100,,6],[100 up to 110,,0]]
Next, plot the midpoint and their corresponding frequency. Connect the dots with a line. Notice that a frequency polygon begins and ends with zero.
The frequency table below summarizes student grades on a final exam. Draw a frequency polygon based on the data.
Grade (%) Frequency 50 up to 60 2 60 up to 70 6 70 up to 80 30 80 up to 90 6 90 up to100 6 Total 50
First find the midpoint of each class interval.
Grade %
Midpoint
Frequency
40 up to 50
0
50 up to 60
2
60 up to 70
6
70 up to 80
30
80 up to 90
6
90 up to 100
6
100 up to 110
0
Next, plot the midpoint and their corresponding frequency.Connect the dots with a line.Notice that a frequency polygon begins and ends with zero.