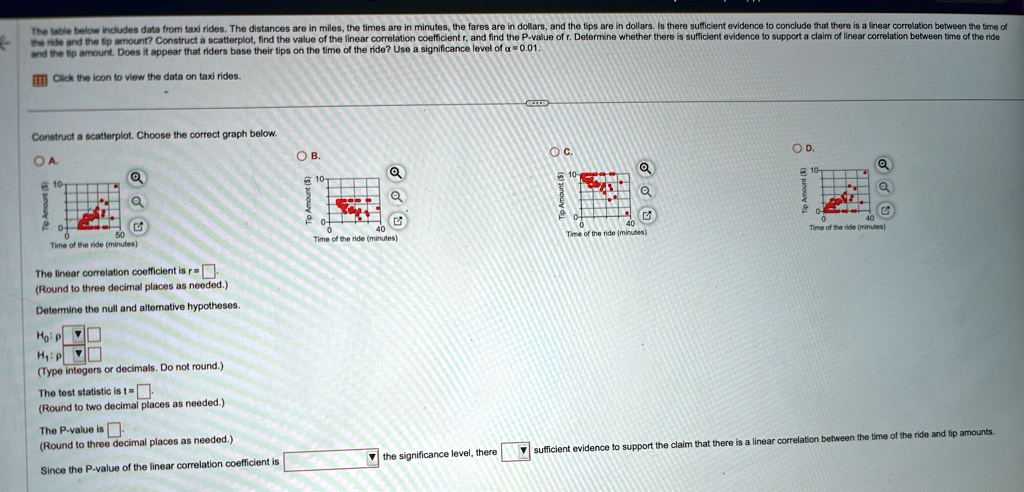
The table below includes data from taxi rides. The distances are in miles, the times are in minutes, the fares are in dollars, and the tips are in dollars. Is there sufficient evidence to conclude that there is a linear correlation between the time of the ride and the tip amount? Construct a scatterplot, find the value of the linear correlation coefficient $r$, and find the $P$-value of $r$. Determine whether there is sufficient evidence to support a claim of linear correlation between time of the ride and the tip amount. Does it appear that riders base their tips on the time of the ride? Use a significance level of $\alpha = 0.01$.
Construct a scatterplot. Choose the correct graph below.
The linear correlation coefficient is $r = \boxed{}$
(Round to three decimal places as needed.)
Determine the null and alternative hypotheses.
$H_0: \rho = \boxed{}$
$H_1: \rho \boxed{}$
(Type integers or decimals. Do not round.)
The test statistic is $t = \boxed{}$
(Round to two decimal places as needed.)
The $P$-value is $\boxed{}$
(Round to three decimal places as needed.)
Since the $P$-value of the linear correlation coefficient is $\boxed{}$ the significance level, there $\boxed{}$ sufficient evidence to support the claim that there is a linear correlation between the time of the ride and tip amounts.