Use the following information to answer Questions 8 through 9:
8. The mean medical expenditure for 25 patients with MSCD is $5,787 and the standard
deviation of those medical expenditures is $10,626. Using this information, calculate a
95% confidence interval for the population-level mean medical expenditure based on
this sample and provide a 1-2 sentence interpretation.
9. A separate analysis of medical expenditure was performed for patients without
evidence of MSCD. The standard error for the mean medical expenditure for this set of
patients is $3,618. Which of the following statements MUST be true? Circle single best
answer.
A. Fewer patients were included in this analysis than the number included in Question
8.
B. The variability of medical expenditures among patients without MSCD in this
analysis is less than the variability among the patients with MSCD in Question 8.
C. The estimated mean medical expenditure in this analysis has more uncertainty than
the estimate calculated for patients with MSCD in Question 8.
D. Increasing the number of patients without MSCD included in this analysis would
decrease the variability of medical expenditures in that group.
E. The distribution of medical expenditures among patients without MSCD in this
analysis is more Gaussian than the distribution of expenditures for patients with
MSCD in Question 8.
10. Suppose a sample of 100 data points with a sample mean of 45 and sample standard
deviation of 12 was used to calculate a certain confidence interval. If the researchers
wanted to reduce the width of that confidence interval by half, how many additional
observations would they need?
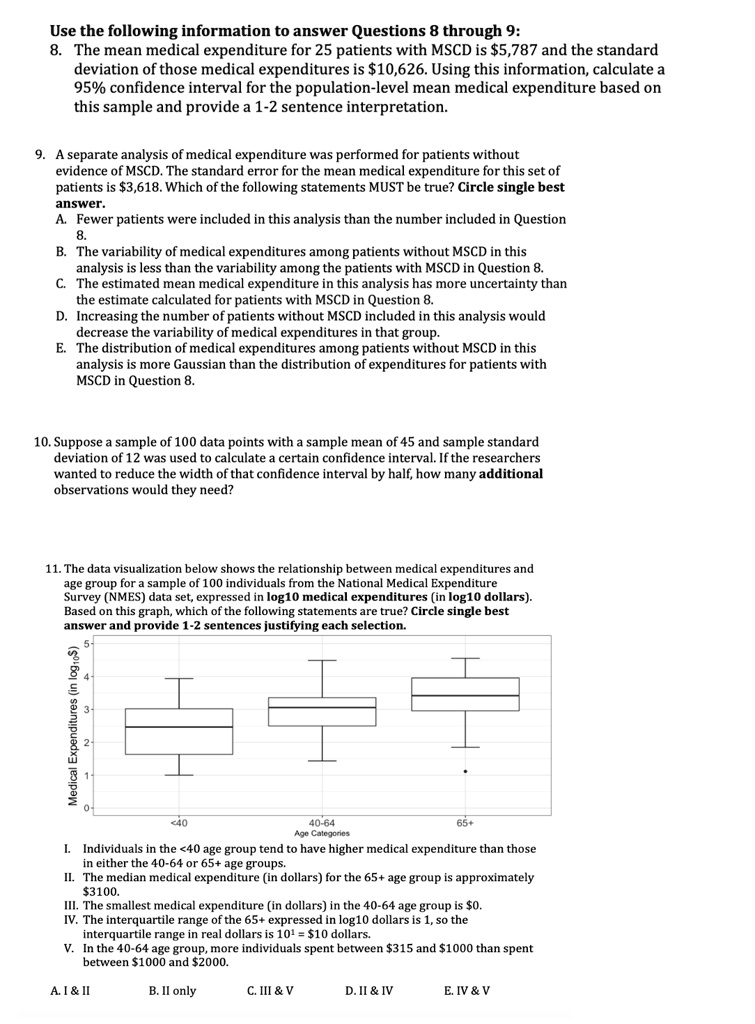
11. The data visualization below shows the relationship between medical expenditures and
age group for a sample of 100 individuals from the National Medical Expenditure
Survey (NMES) data set, expressed in log10 medical expenditures (in log10 dollars).
Based on this graph, which of the following statements are true? Circle single best
answer and provide 1-2 sentences justifying each selection.
4
3
Medical Expenditures (in log10$)
2
1
<40
40-64
Age Categories
65+
I. Individuals in the <40 age group tend to have higher medical expenditure than those
in either the 40-64 or 65+ age groups.
II. The median medical expenditure (in dollars) for the 65+ age group is approximately
$3100.
III. The smallest medical expenditure (in dollars) in the 40-64 age group is $0.
IV. The interquartile range of the 65+ expressed in log10 dollars is 1, so the
interquartile range in real dollars is 101 = $10 dollars.
V. In the 40-64 age group, more individuals spent between $315 and $1000 than spent
between $1000 and $2000.
A. I & II
B. II only
C. III & V
D. II & IV
E. IV & V